You can use dashboard filters to narrow the scope of the data presented on a
dashboard. You can qualify your environment’s data based on the following filters: Time
Range, Scope, Application, Server, Client, and Status.
Three filters display by default on each dashboard: Scope, Application, and Server. You
can select these filter items by clicking the desired menu and selecting the check boxes
for the details you want included in the results.
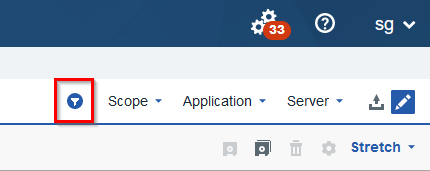
You can enable additional filtering options by clicking the
Edit
Mode button. When you enable
Edit Mode, a
clickable filter icon is displayed with a drop-down menu where you can enable the
remaining filters: Time Range, Client and Status. Activate these filters by selecting
the corresponding check box and the additional menus display on the interface.
Figure 1. Filter icon
You can also save filters as part of a dashboard so each time the dashboard is refreshed,
the desired filters are already set. Simply set your filters and save the
dashboard.
Tip: You can combine filters to narrow the results for more
specific information.
Note: A yellow warning indicator appears on each
dashboard widget that doesn’t use all of the enabled filters. The indicator is
displayed on the
Configure icon of a widget when
Edit Mode is enabled. Be sure to enable filters that make
sense for the widgets on your dashboards and use filter variables in data set
queries in a widget's configuration.
In addition, the Query Builder in Wizard
mode automatically sets all of the filter variables that apply for a particular
query. However, you can add your own conditions connected with the filters in
accordance with the column type by selecting an available option in the
Operator drop-down menu.